
Skip to content
Agency Pilot

Agency dashboard

Mission Control: every client, every number

Open Agency Pilot and the first thing you see is every client's spend, leads, cost per lead, booking rate and revenue for the period — with the clients that need you today at the top, and the reason spelled out.

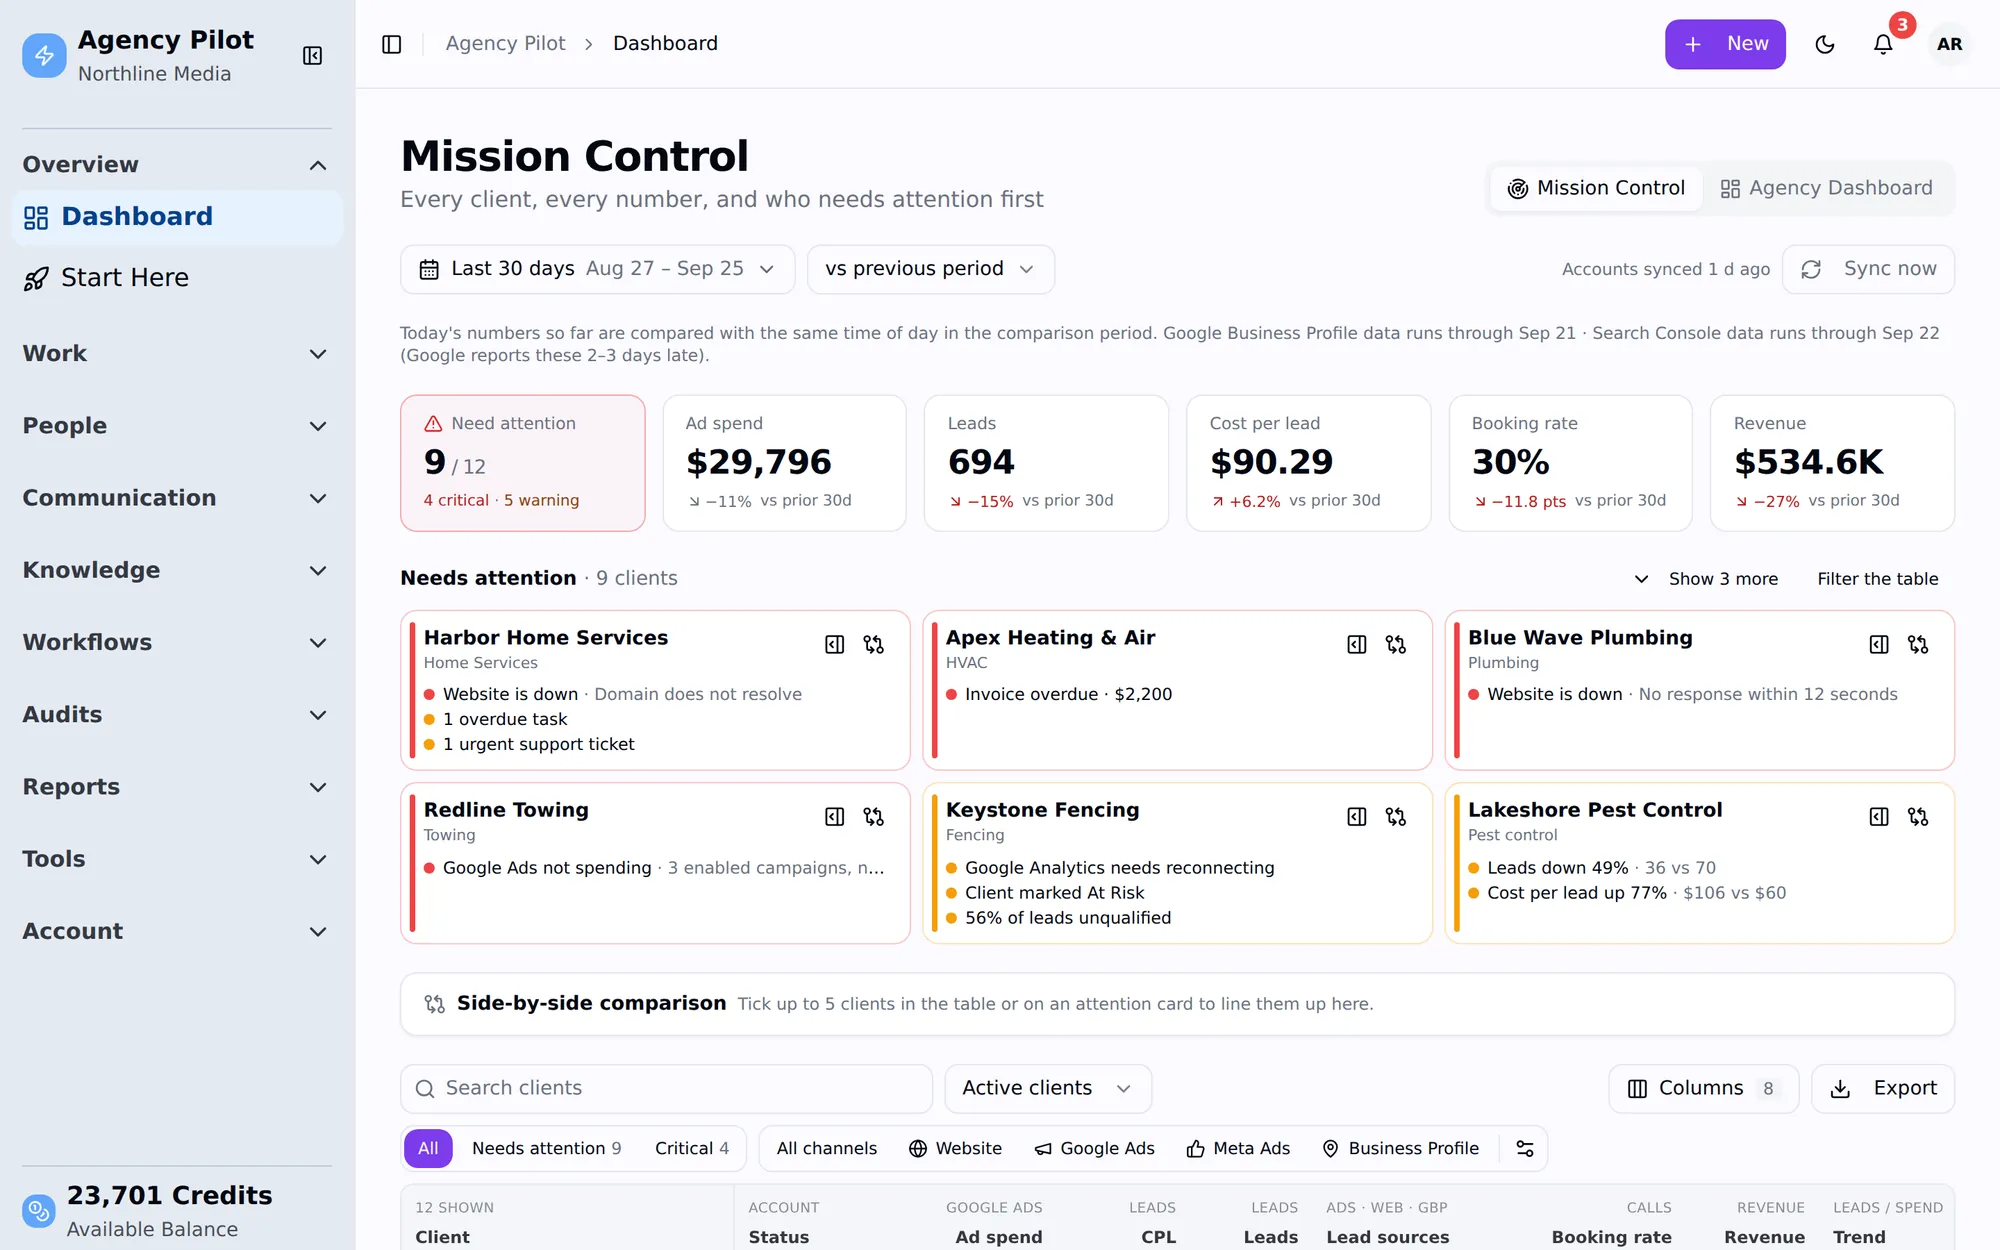
Agency Pilot Mission Control: nine clients needing attention, $29,796 ad spend, 694 leads, $90.29 cost per lead, 30% booking rate and $534.6K revenue over 30 days, with attention cards per client
Thirty days across twelve clients: totals, changes, and who needs attention first.

Needs attention, worst first

Leads down, cost per lead up, ads spending with no leads, missed calls, sites down, overdue invoices and tasks — flagged per client.

Agency totals

Ad spend, leads, cost per lead, booking rate and revenue across every client, against the previous period or last year.

A table you can shape

Pick columns from about sixty metrics, filter by channel, sort, and export to CSV.

Side by side

Tick up to five clients and line them up to see who's really out of line.

Always current

Accounts sync hourly with a 400-day backfill; websites are checked every 15 minutes.

Same numbers for the client

Each client's own dashboard and portal use the same data, without your internal notes.

Start the day with the right client

The attention cards are the point. Each one names the client and the reason — "Google Ads not spending · 3 enabled campaigns, no spend in 3 days", "Leads down 49% · 36 vs 70", "Website is down · no response within 12 seconds" — ordered critical first. Most mornings, that's the to-do list.

Thresholds are sensible out of the box: leads down 30% or more, cost per lead up 30% or more, $150 of ad spend with no ad leads, a quarter of calls missed, half of leads unqualified, a website down, an invoice overdue or tasks overdue.
Every client in one table

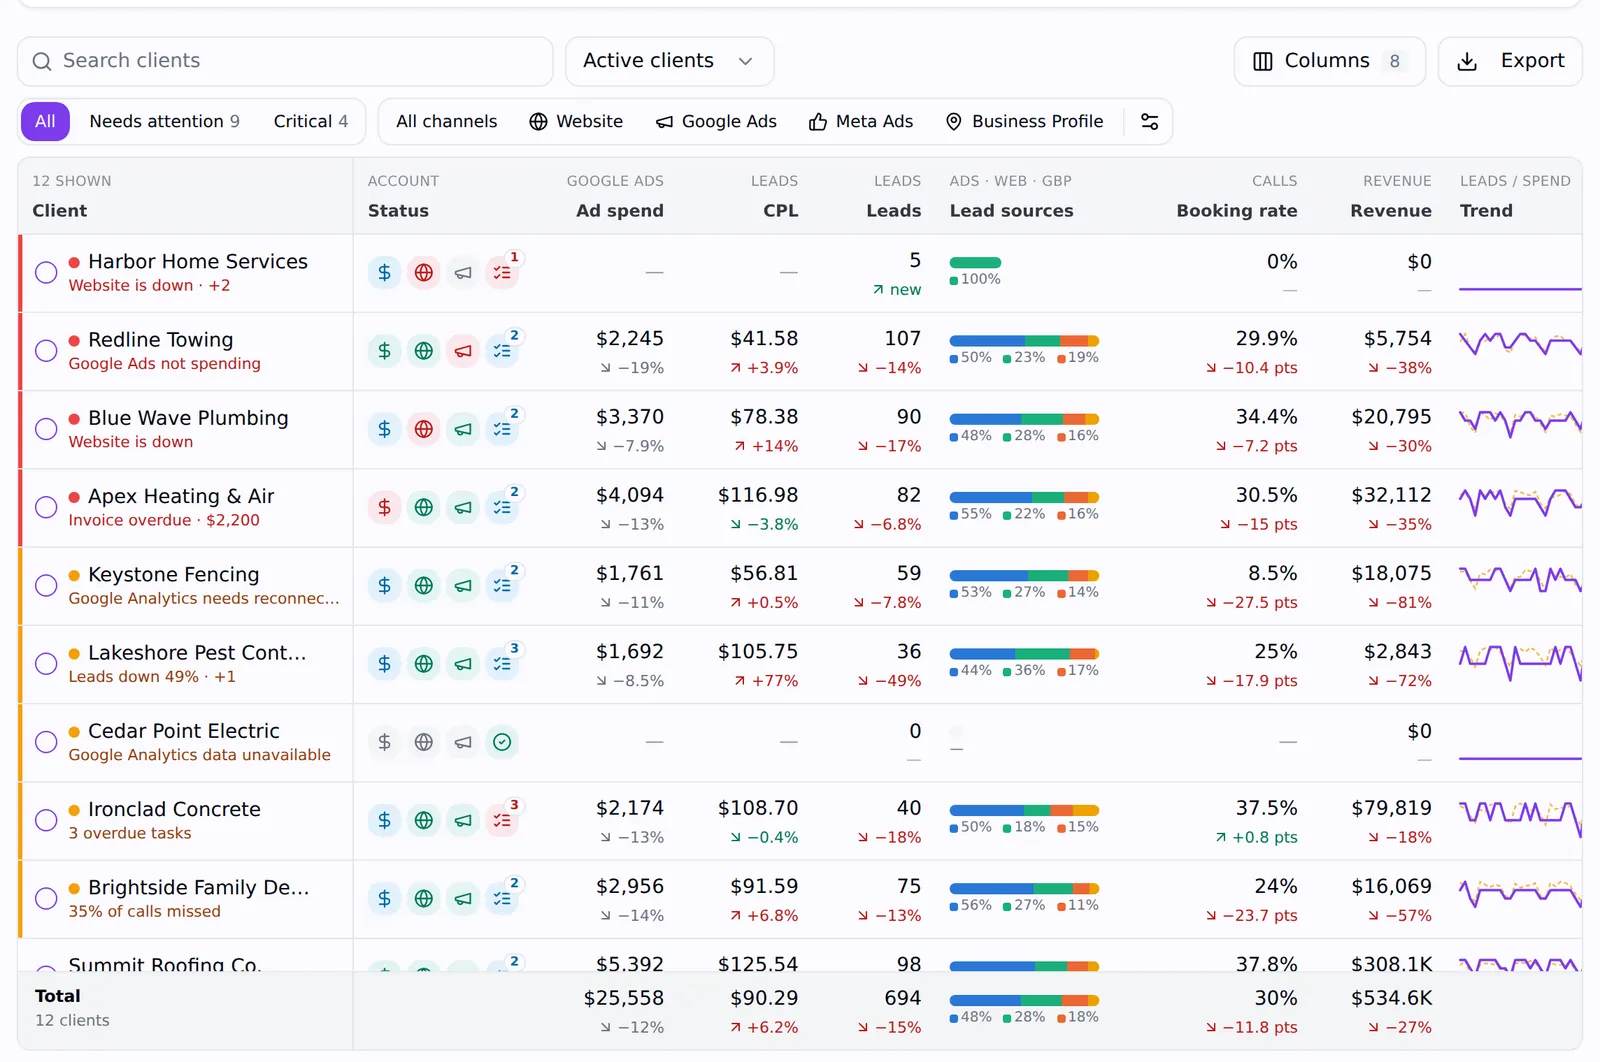
Below the cards, every client sits in one sortable table: status, ad spend, cost per lead, leads, lead sources, booking rate, revenue and a leads-versus-spend trend line. Switch channels — website, Google Ads, Meta Ads, Business Profile — to see the same table for just that source, and export anything to CSV.

The Mission Control client table with ad spend, cost per lead, leads, lead sources, booking rate, revenue and trend sparklines per client
Every client, sortable, with trend lines and channel filters.

Click into any client

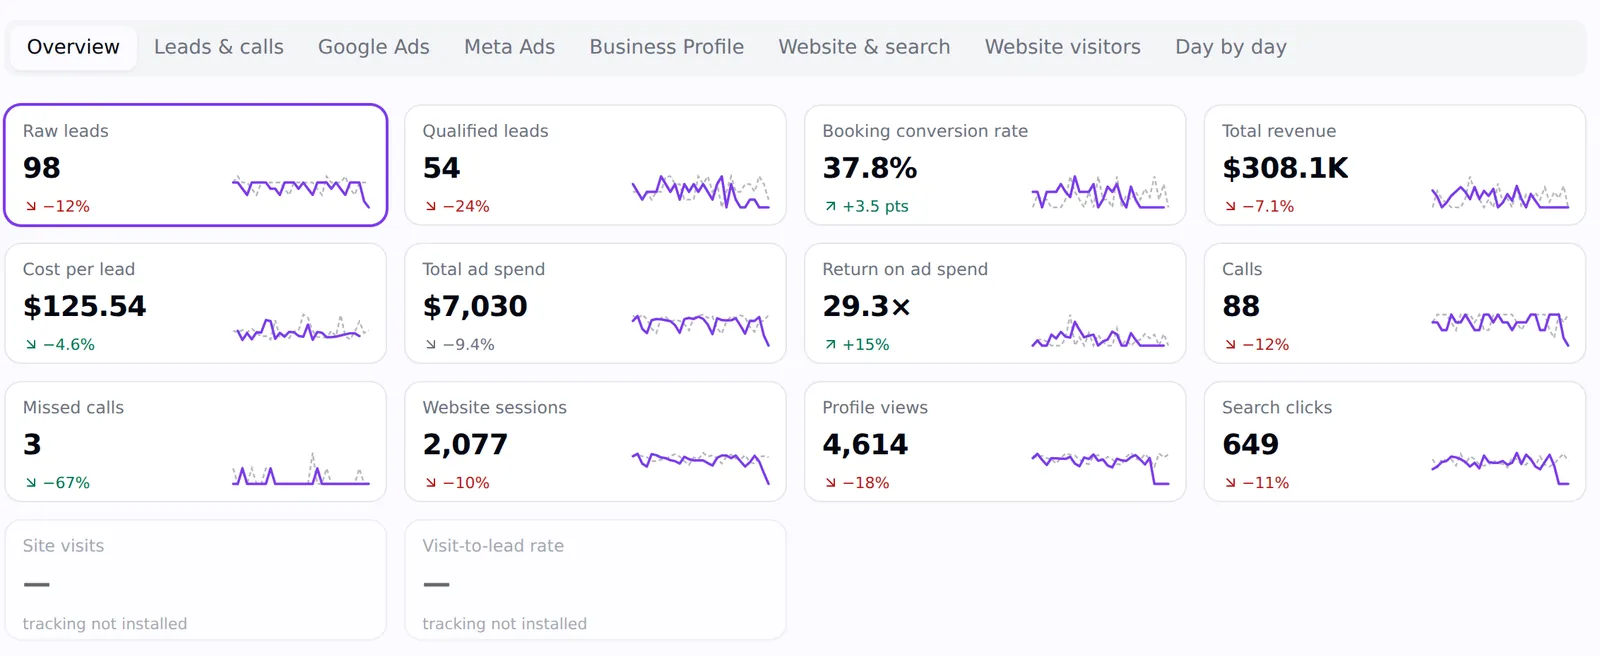
Each client opens to their own dashboard: account health, data-source status, leads over time, and tiles for leads, qualified leads, booking rate, revenue, cost per lead, ad spend, ROAS, calls, missed calls, website sessions, profile views and search clicks — each with a sparkline. Below that, leads by source, ad spend against leads, calls answered and missed, and lead quality.

A client's dashboard tiles: 98 leads, 54 qualified, 37.8% booking rate, $308.1K revenue, $125.54 cost per lead, $7,030 ad spend, 29.3× ROAS, 88 calls, 3 missed calls, website sessions, profile views and search clicks
One client's month: leads, bookings, revenue, cost and return, with sparklines.

The numbers

What Mission Control tracks

SourcesGoogle Ads, Meta Ads, Google Analytics 4, Search Console, Business Profile, the tracking script, calls, forms, chats and texts
MetricsAbout sixty, including spend, clicks, leads, cost per lead, booking rate, calls, missed calls, talk time, revenue (new, repeat, other), average job, jobs sold, ROAS and ROAS on new customers
PeriodsToday, yesterday, 7/30/90 days, month, year to date or custom, against the previous period or last year
SyncHourly per source, with a 400-day backfill on the first sync; website checks every 15 minutes
On the phoneAgency Mission Control in the LeadPulse app, with the same attention list

What this does not do

Better to find this out here than three weeks in.

  • Business Profile and Search Console data arrive 2–3 days late because Google publishes them late; the dashboard says which day each source runs through.
  • Revenue and ROAS depend on sold jobs being recorded — by your team, by the client in their portal or app, or from sales sent in by webhook.

Questions

What is an agency Mission Control dashboard?
One screen showing every client's marketing performance — spend, leads, cost per lead, bookings and revenue — with the clients that need attention first and the reason why.
Can clients see Mission Control?
Clients see their own dashboard in the portal and app, with the same numbers for their business only. They never see other clients or your agency view.
How fresh is the data?
Hourly for ad platforms and Analytics, every 15 minutes for website checks, and you can press Sync now at any time.

Put your agency on autopilot

Start a 14-day trial with 300 credits. Add your first client and send an onboarding link today.