
Skip to content
Agency Pilot

Client dashboards

A live marketing dashboard for every client

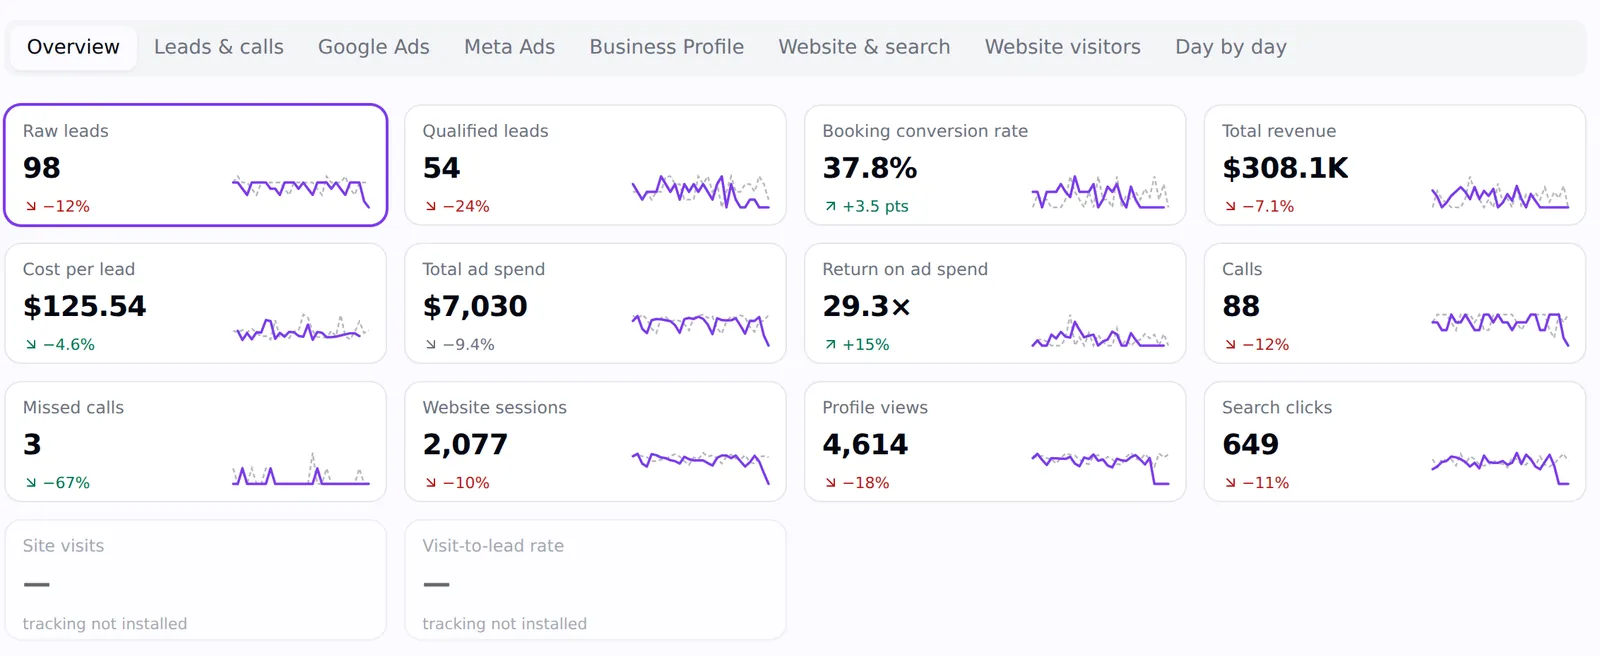
Each client gets a dashboard of their own: leads and where they came from, bookings and revenue, ad spend and return, calls, website traffic and Business Profile views — all against last period, on the web and in the LeadPulse app. It's the same view your team uses, minus your internal notes.

A client dashboard with leads, qualified leads, booking conversion rate, revenue, cost per lead, ad spend, return on ad spend, calls, missed calls, website sessions, profile views and search clicks
One client's month at a glance, with sparklines and change against the previous period.

Every source, one view

Google Ads, Meta Ads, GA4, Search Console, Business Profile, the tracking script and calls, together.

Leads to revenue

Raw and qualified leads, booking rate, revenue, cost per lead and ROAS — not just clicks.

Calls counted

Answered and missed calls, talk time and missed-call alerts.

Any period

Today, yesterday, 7, 30 or 90 days, month, year to date or custom, against the previous period or last year.

Account health

Billing, website status, ads delivery and open tasks at the top; sources that stop reporting are flagged.

In their pocket

The same dashboard in the LeadPulse app, with new-lead alerts.

The numbers owners actually ask about

Clicks and impressions are your numbers. Owners ask how many enquiries came in, how many turned into jobs, what those jobs were worth, and what it cost. The dashboard leads with those — leads, qualified leads, booking rate, revenue, cost per lead, ad spend and return on ad spend — then shows calls, missed calls, website sessions, profile views and search clicks underneath.

Where the leads came from

Leads by source shows ads, website, Business Profile and other leads day by day; ad spend against leads shows whether more budget bought more enquiries; calls show answered against missed; and lead quality shows qualified, unqualified and not yet reviewed. The lead sources table adds bookings, revenue and average job value per source.

Charts on a client dashboard: leads by source, ad spend and leads, calls answered and missed, and lead quality
Leads by source, spend against leads, calls and lead quality.

Explore any metric

Pick a metric and see it by day against the comparison period, or across twelve months. The day-by-day grid exports to CSV. Separate sections dig into leads and calls, Google Ads (top campaigns and search terms), Meta Ads, Business Profile (views and search keywords), and the website (GA4 channels, cities, devices and pages; Search Console queries and pages).

The metric explorer showing raw leads by day with best day, weakest day and daily average
Any metric by day, against the previous period.

What this does not do

Better to find this out here than three weeks in.

  • Google publishes Business Profile and Search Console data 2–3 days late; the dashboard says which day each source runs through.
  • Revenue and ROAS need sold jobs recorded — by your team, by the client, or sent in by webhook.
  • Clients see their own dashboard only; the cross-client Mission Control view is for your agency.

Questions

Can clients see their marketing results without a report?
Yes. They log in to the portal or the LeadPulse app and see a live dashboard of their own results, any time.
Which accounts feed the dashboard?
Google Ads, Meta Ads, Google Analytics 4, Search Console and Business Profile, connected through an onboarding link, plus leads and calls captured in Agency Pilot.
How often does it update?
Accounts sync hourly, with a 400-day backfill the first time they connect.

Put your agency on autopilot

Start a 14-day trial with 300 credits. Add your first client and send an onboarding link today.