
Skip to content
Agency Pilot

Local SEO

Geo grid rank tracker

A local business doesn't have one ranking. It has a different one on every street. A geo grid scan searches from dozens or hundreds of points across the service area and colours the map in — on Google Maps, the Local Finder and organic results.

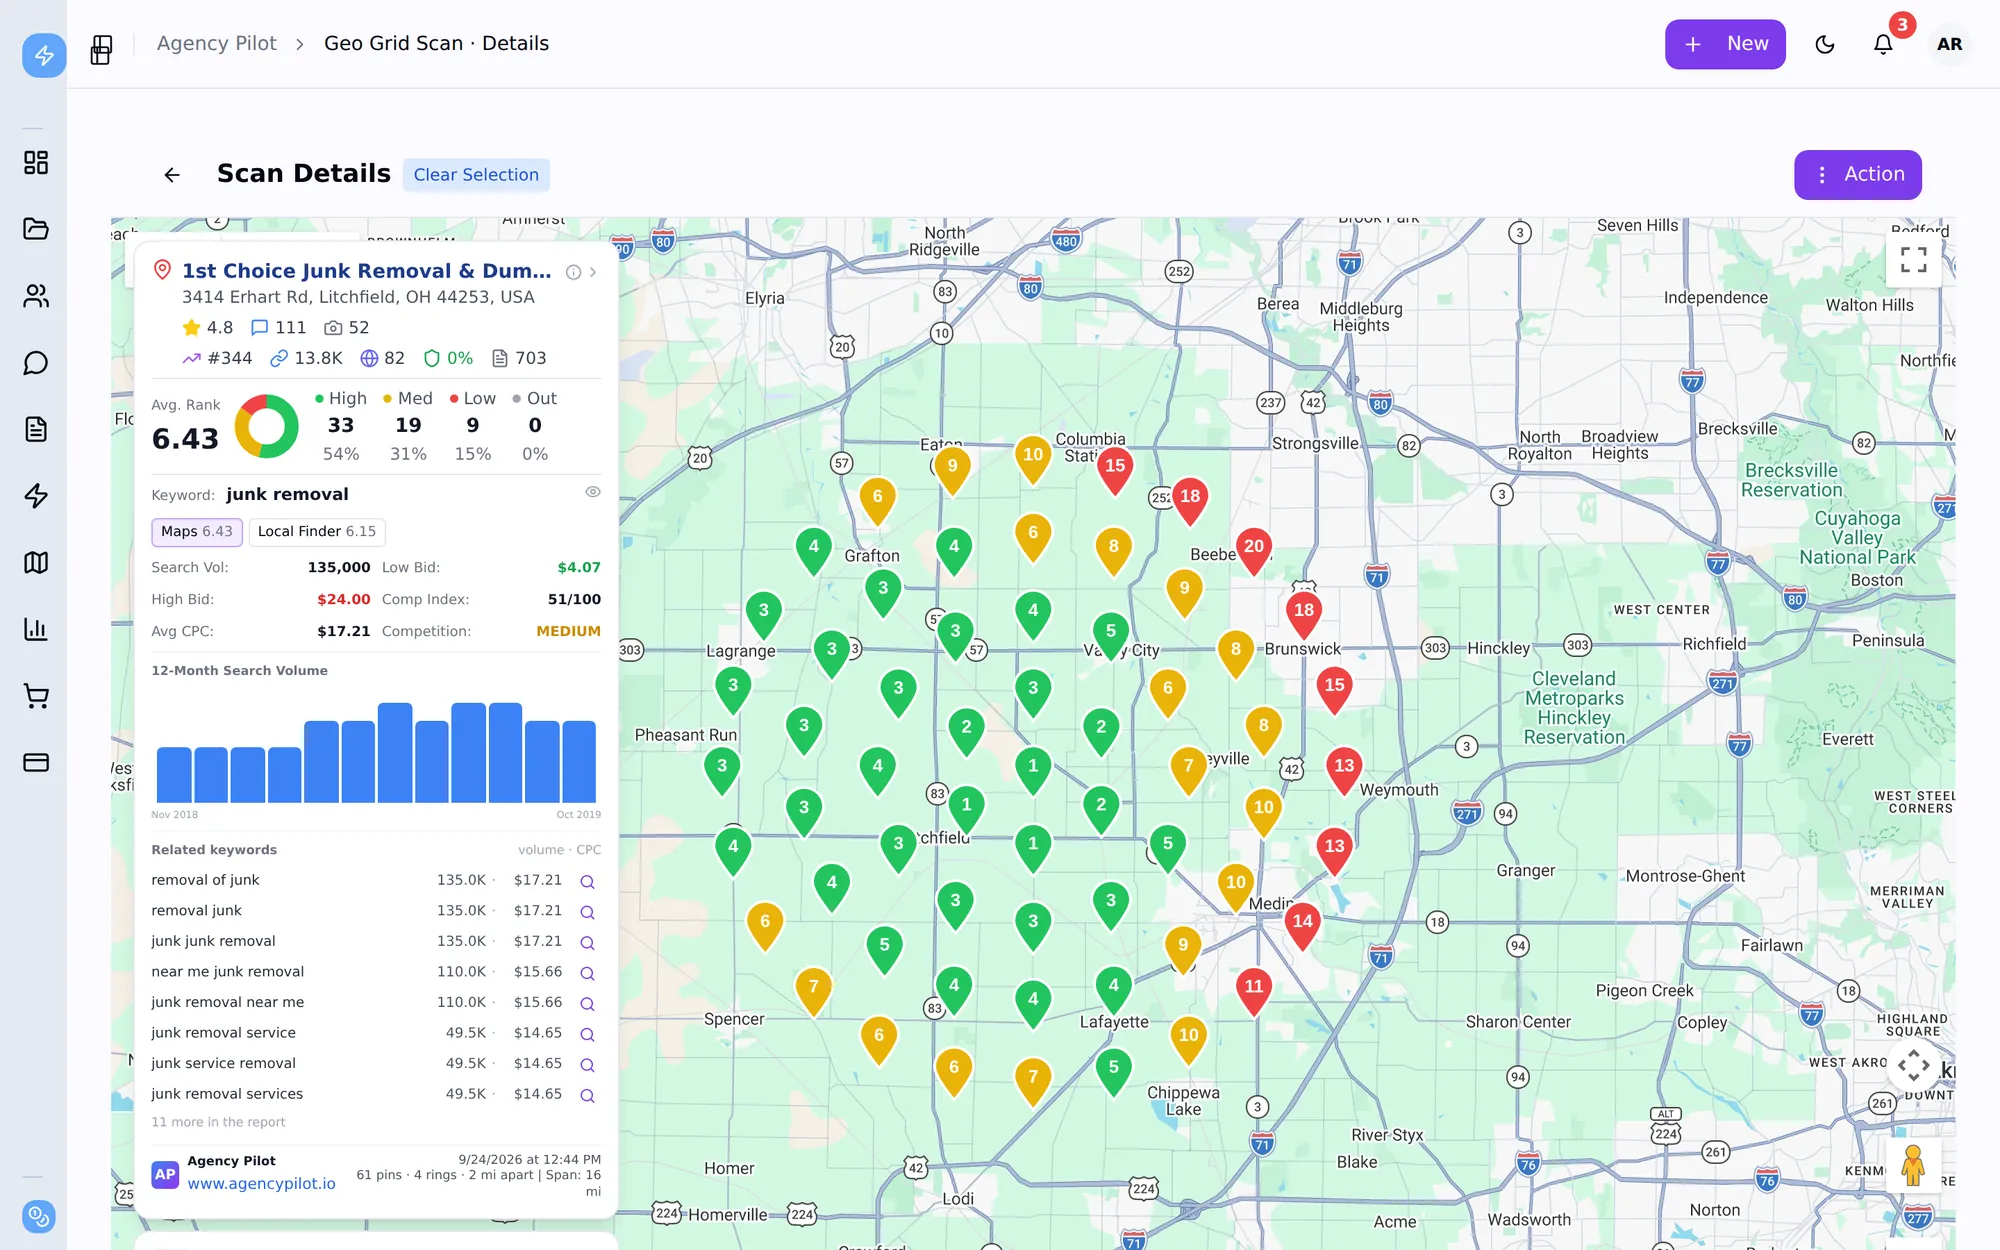
An Agency Pilot geo grid scan for a junk removal company: a circular grid of numbered pins over the map, green where it ranks in the top 3, and a panel with average rank, distribution and keyword data
A real Google Maps scan: 61 points on a circular grid, average rank 6.43, with search volume and related keywords alongside.

Up to 441 points

Square grids from 3×3 to 21×21, or circular grids of 1 to 11 rings (7–397 points) that follow a real service radius.

Three scan types

Google Maps, the Local Finder and organic Google results from the same grid, linked so you can compare them.

Depth to the top 100

Measure to the top 10, 20, 30, 50 or 100, so a business outside the pack still has a position — not just "20+".

Competitors at every point

Every point records the full result, so you see who owns the area your client is losing.

Competitor alerts

Get told when a competitor takes top-3 spots, jumps sharply, or your client's coverage drops.

Shareable and reportable

Public share links, CSV export, scan history, side-by-side comparison and branded geo-grid reports.

Why one ranking number is misleading

Ask most rank checkers where a plumber ranks for "emergency plumber" and they'll search from one spot — the middle of the city, or the business itself. Searching from the business is the most flattering test there is, because proximity is one of the strongest signals in the local pack.

Drive four miles and the same search can put the business off the map. A geo grid runs the search from every point in a grid across the service area, so you see coverage, not a position — and the shape of the red usually explains exactly what the client has been complaining about.
How a scan works

Pick the business (search for it, paste a Google Maps link, or type its name, phone and website), the keyword, the center point, the grid and the spacing. Each point runs its own search from those exact coordinates, records the complete result, and stores where the business landed — or that it wasn't found within your chosen depth.

Points fill in as they complete. When the scan finishes you get the heat map, the average rank and distribution, a ranked list of every competitor that appeared, and the raw result behind every point, with a verify link so you can check any of them yourself.

  • Square grids 3×3 to 21×21, or circular grids of 1–11 rings
  • Spacing from 0.1 to 5 miles or kilometres between points
  • Search depth: top 10, 20, 30, 50 or 100
  • Google Maps, Local Finder and organic scans, linked when run together
  • Service-area businesses with hidden addresses matched by their Maps listing ID

Numbers you can explain to a client

Top-3 coverage is the share of grid points where the business is in the top three — the ones that win the map pack. Found share is the share of points where it appears at all within your search depth. Average rank on the scan averages the points where it was found; the scan report also gives an overall average in which a point where the business wasn't found counts as one position beyond your depth, so the number never hides what it's counting.

Pins are coloured by rank and grouped into high, medium, low and not found, so a client can read the map without a legend lecture.

Analyze: why the competitors are winning

Click Analyze on a finished scan and Agency Pilot lines the business up against the five competitors that appear most often: rank, rating, reviews in the last 30 and 90 days, reply rate, photos, primary category, whether the profile is claimed, hours and open-24-hours. Review velocity fills in as review checks finish.

It also pulls search volume, cost per click and 12 months of seasonality for the keyword, related keywords you can scan with one click, and the number of pages the site has indexed. That's usually enough to tell the client why they're losing a side of town, not just that they are.

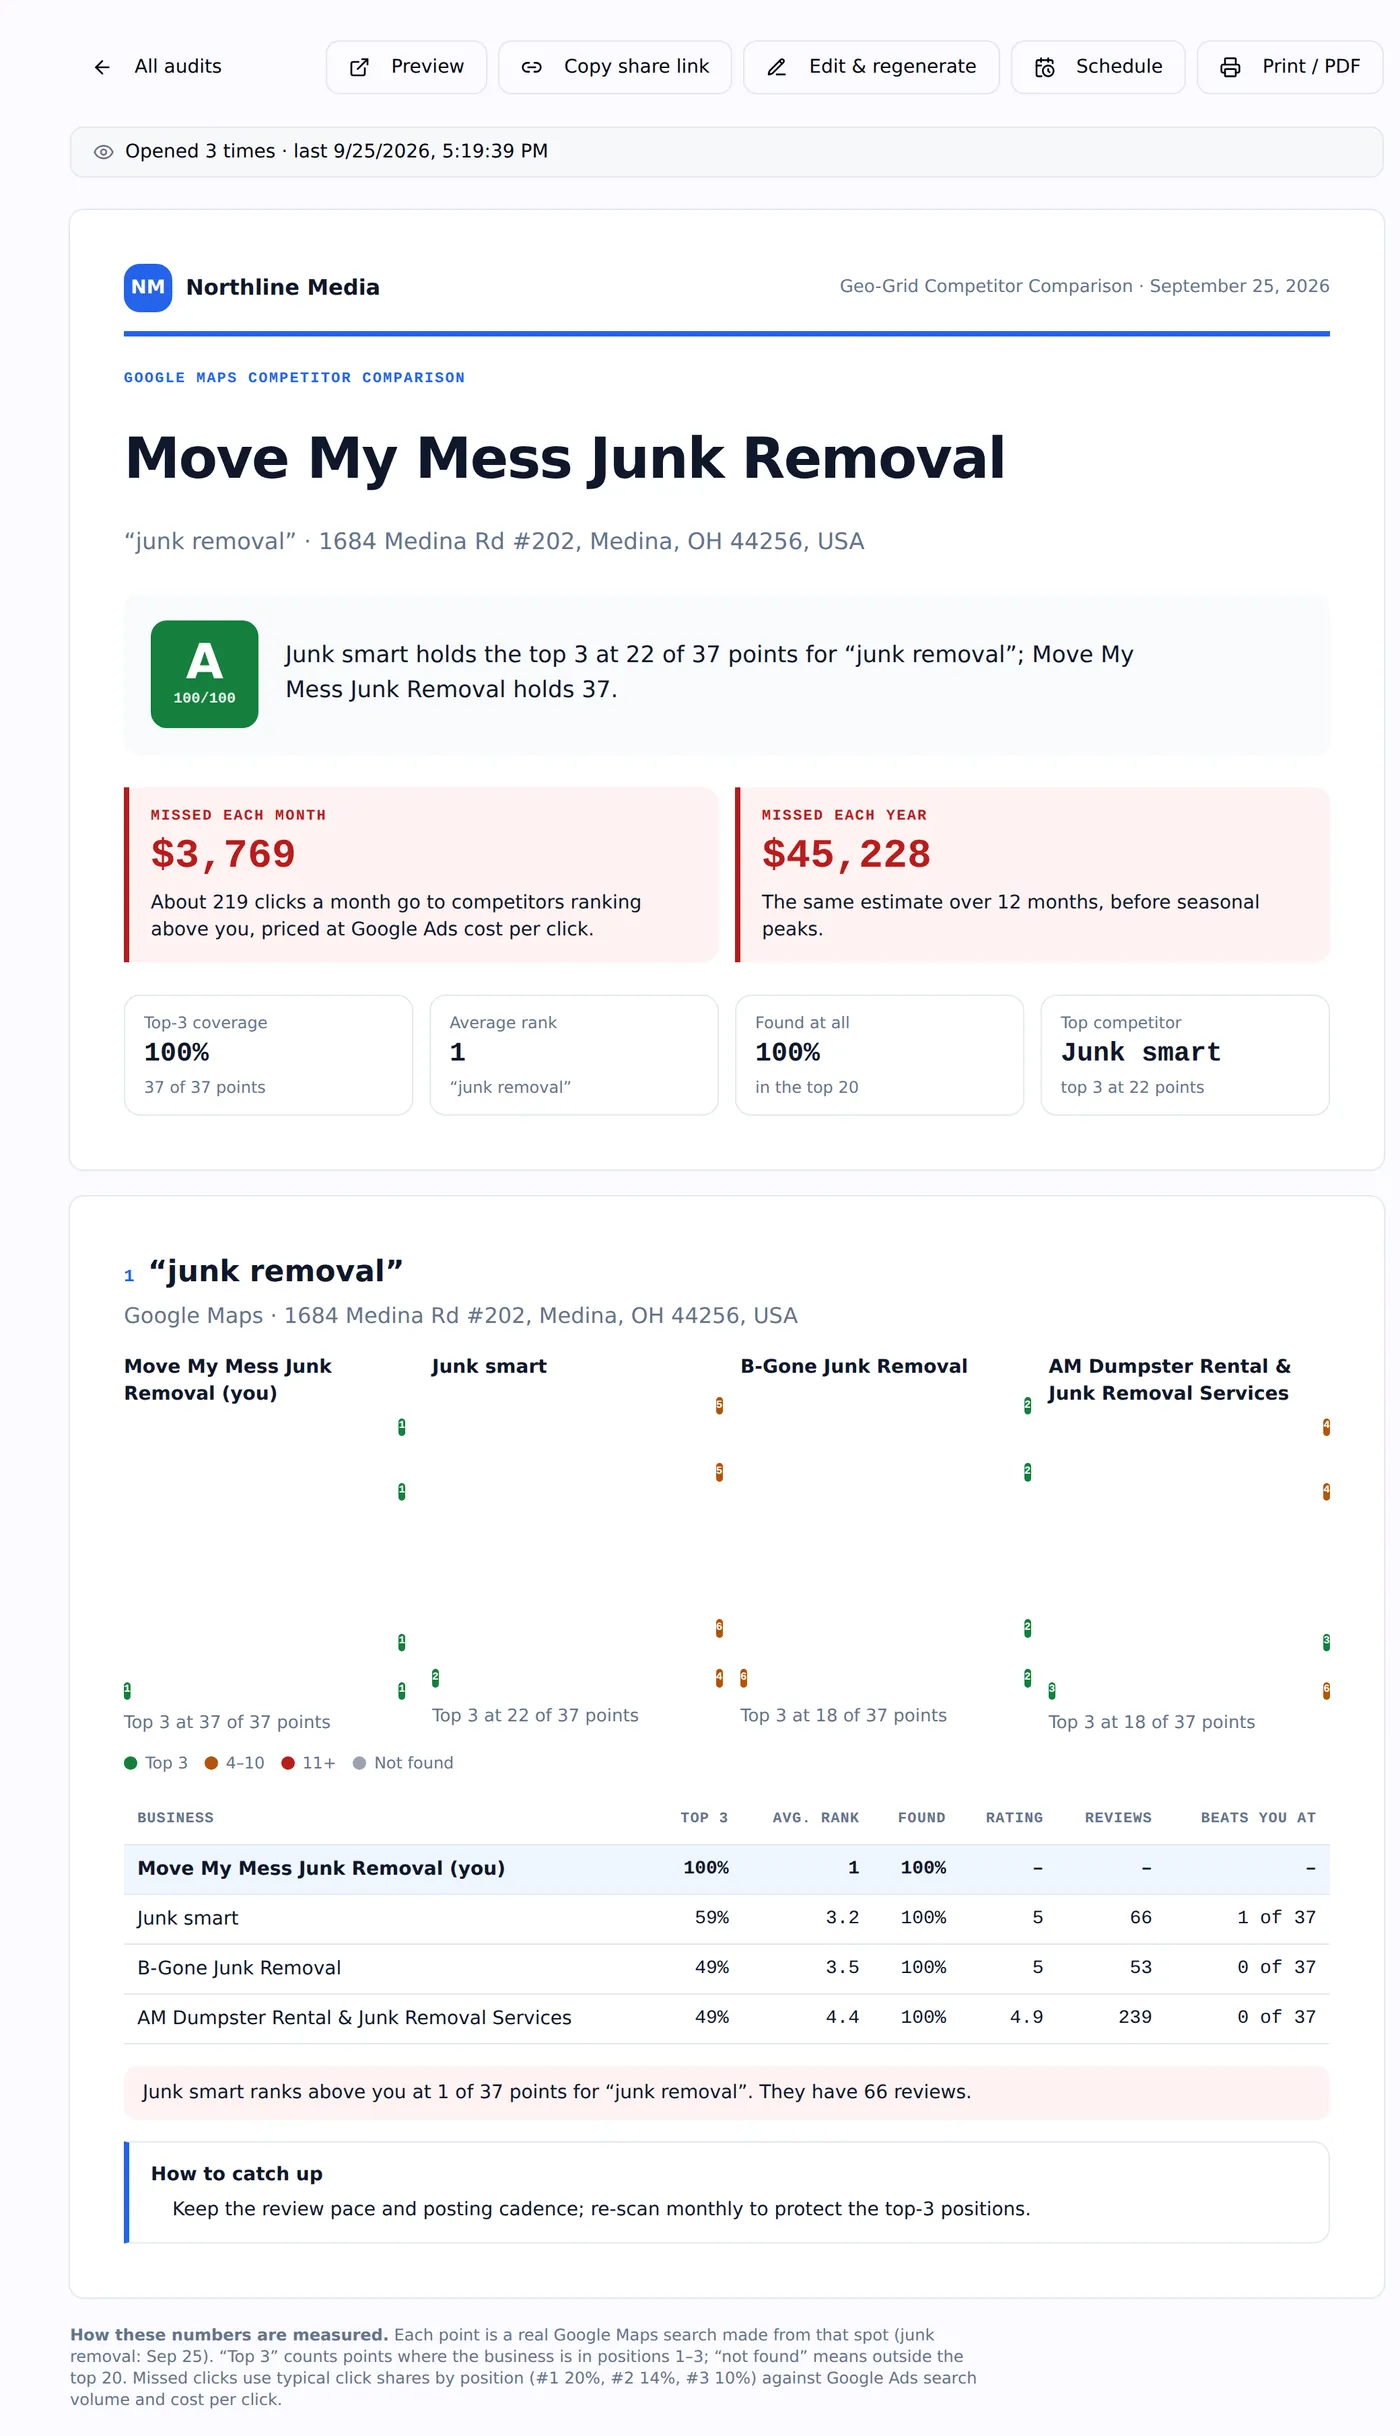
A branded geo-grid competitor comparison report showing an A grade, missed revenue of $3,769 a month, top-3 coverage and a table of competitors
Scans become a branded competitor comparison, with missed clicks priced in dollars.

From scan to report to renewal

Three geo-grid report types turn scans into something a client or prospect reads: the Visibility Report (heat maps per keyword, top-3 coverage, weakest directions and missed clicks in dollars), the Competitor Comparison (the business against up to three competitors on the same grid) and Ranking History (coverage and average rank over time). Each carries your logo and colours, can be scheduled weekly or monthly, and tells you when it's opened.

A red map turning green over six months is the clearest retainer justification there is. The history report makes it one link.

The numbers

Grids, depth and what a scan costs

Scans are priced in credits by the number of points and the delivery speed; the scan form shows the exact cost before you run it.

Google Maps scan, 61 points25 credits standard · 49 credits fast
Google Search (organic) scan, 61 points43 credits standard
Grid shapesSquare 3×3 to 21×21, or circular 1–11 rings (7–397 points)
Spacing0.1 to 5 miles or kilometres between points
Search depthTop 10, 20, 30, 50 or 100
Scan typesGoogle Maps, Local Finder and Google Search, each its own scan

What this does not do

Better to find this out here than three weeks in.

  • It measures Google. Apple Maps and Bing Places aren't scanned.
  • Each scan type (Maps, Local Finder, organic) is its own scan and uses its own credits.
  • Raw scans aren't shown in the client portal. Share a link, or mark a geo-grid report visible to the client.
  • Results reflect Google at the moment of the scan. Personalisation, device and time of day can make an individual search differ from what one person sees on their phone.

Questions

What is a geo grid rank tracker?
A tool that runs the same local search from many points across an area and maps where a business ranks at each one. It shows local visibility the way customers actually experience it, instead of one rank from one location.
What grid size should I use?
For a single-location business in a city, a 7×7 or 9×9 grid at half a mile to a mile apart covers most service areas. Use a circular grid for a radius-based service area, and bigger grids or wider spacing for rural areas.
What's the difference between Maps, Local Finder and organic scans?
Maps is the Google Maps app and map results. The Local Finder is the full list you get after clicking "more places" from the local pack. Organic is the regular blue-link results. A business can do well on one and badly on another, which is why they're separate scans.
How deep does a scan look?
As deep as you choose: the top 10, 20, 30, 50 or 100 results at each point.
Can I scan a prospect before they're a client?
Yes. Scans work from public results, so you can scan any business — and share the map with a prospect without them creating an account.
Can I track a service-area business without an address?
Yes. Paste the Maps share link or type the name, phone and website; the scan matches the listing by its Maps ID.
How often should I re-scan?
Monthly is enough for most clients; weekly during an active campaign. Schedule a geo-grid report and the scans run on that schedule.

Run your first geo grid today

Start a 14-day trial with 300 credits — enough for a dozen 61-point Maps scans.